Open Microsoft Excel and go into Excel Options. In Office 2007 click the Office button » Excel Options » Advanced. In Excel 2010 click the File Tab » Options » Advanced.
Scroll down in Advanced Options menu to Display Options for this Worksheet. Check the Show Gridlines option (if not checked) and select the color you want. Click Ok when done.
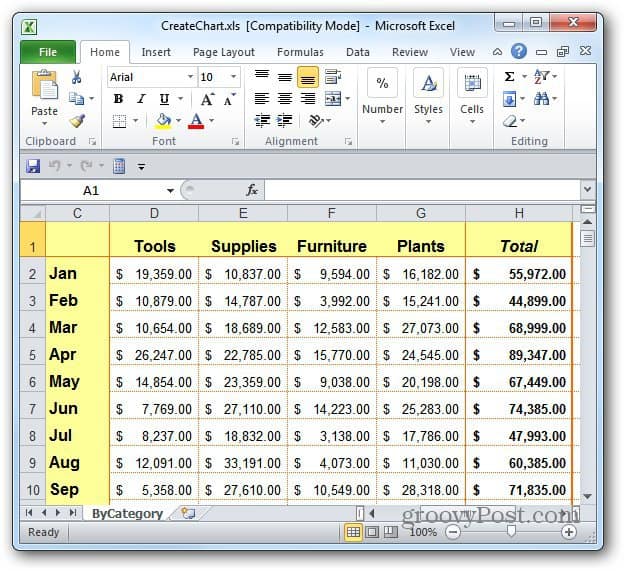
That’s it. Here is an example of an Excel chart where I changed the Gridlines to the color orange.
In Excel default border color is like _ but when i Select a color or grey it becomes …… grid. I want solid 1 color _ in the color i want.. Hope that makes sence. Excel default grid color is solid 1 color no …. just a straight _ line.. Comment Name * Email *
Δ Save my name and email and send me emails as new comments are made to this post.


